The Content Treadmill vs. The Asset Engine
Let’s address the most expensive myth in the creator economy: "More content equals more income." This belief keeps thousands of creators stuck on a content treadmill—publishing daily, chasing algorithmic scraps, and burning out while revenue stagnates. They optimize for output. Professionals optimize for architecture.
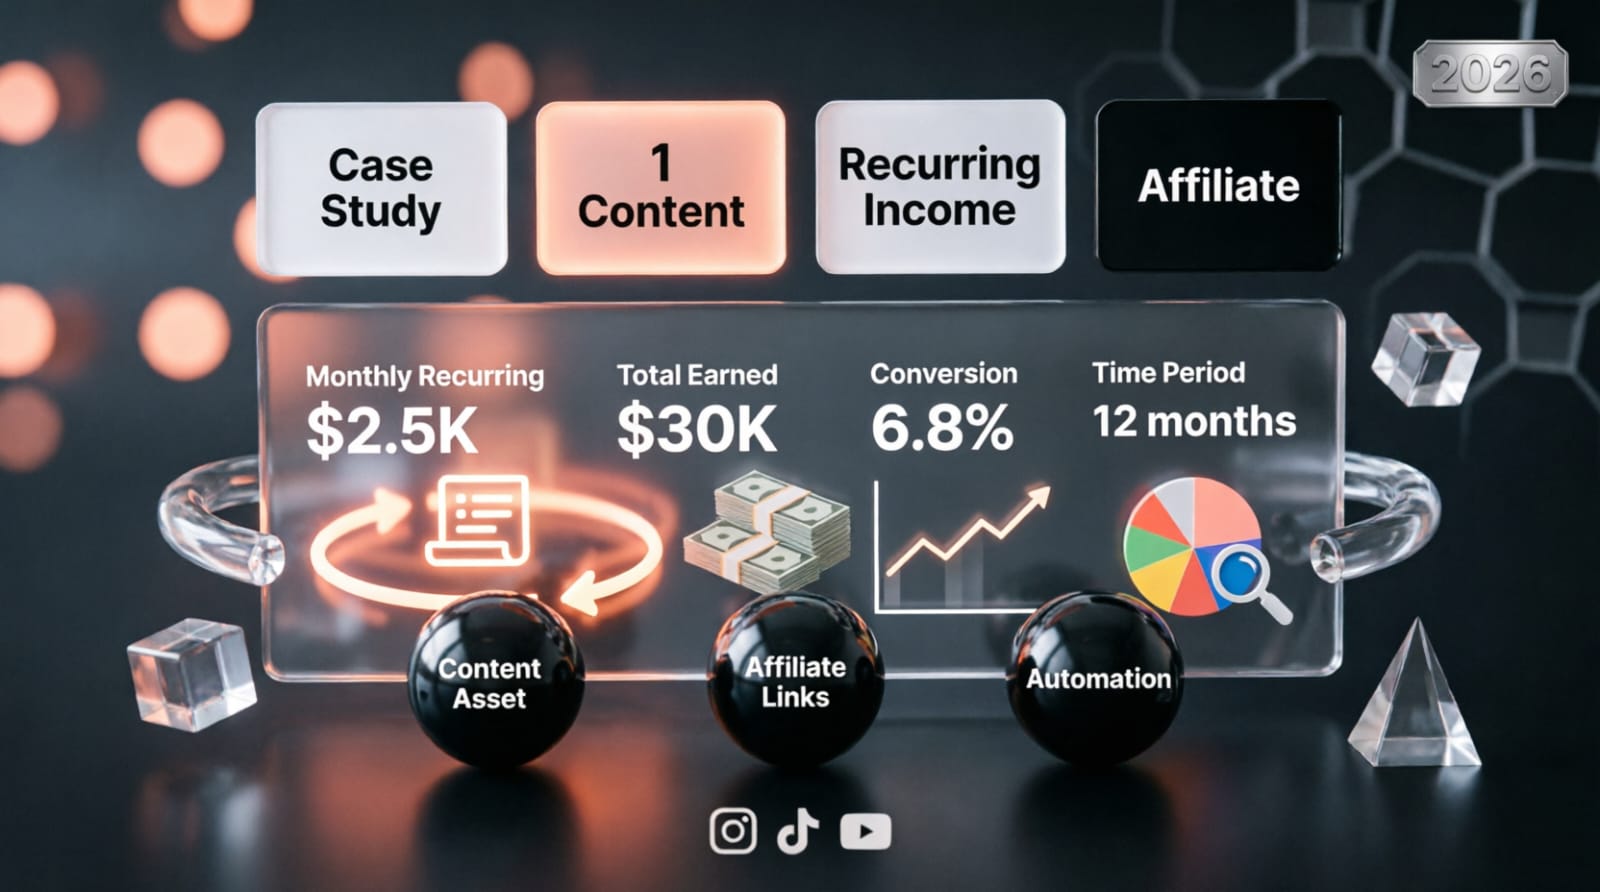
This case study dismantles the volume trap. It documents how a single, strategically engineered comparison article generated predictable, recurring affiliate income for 18+ months—without viral spikes, paid ads, or an existing audience. The difference wasn't luck. It was treating content as a revenue asset, not a disposable post.
When you shift from "How much can I publish?" to "How much value can this asset compound?", the math changes completely. One high-intent page, optimized systematically, will consistently outperform 50 generic articles. This is how scalable creator businesses are actually built.
Why Comparison Content Converts: The Psychology of Decision Thresholds
Not all search queries carry equal commercial weight. Users typing "best project management tools" are in exploration mode. Users typing "ClickUp vs Asana for remote teams" are at the decision threshold. They've already identified the problem, researched options, and are holding their credit card. They're not looking for education; they're looking for validation.
Comparison content works because it solves decision fatigue. Cognitive psychology shows that when users face multiple similar options, mental load increases and abandonment rates spike. A well-structured comparison acts as a cognitive offload: it organizes chaos, clarifies trade-offs, and provides a clear path forward. This is why comparison pages consistently achieve:
- 3-5x Higher CVR: Bottom-funnel intent naturally converts better than top-funnel awareness.
- Longer Dwell Time: Users engage deeply with comparison tables, pricing breakdowns, and use-case mapping.
- Lower Bounce Rates: The content directly answers the query, satisfying search intent immediately.
The article in this case study didn't "sell." It facilitated. By reducing friction and aligning perfectly with buyer psychology, it turned casual readers into consistent buyers. For a deeper breakdown of the behavioral triggers that drive ethical conversions, read Why People Actually Click Affiliate Links in 2026 (Psychology of Conversions).
The 4-Pillar Optimization System
The success of this asset wasn't accidental. It was engineered using a repeatable, data-driven framework. Most creators publish and forget. This creator treated the article as a living revenue engine, optimizing across four interconnected pillars.
| Pillar | Core Objective | Key Tactic | Revenue Impact |
|---|---|---|---|
| 1. Intent-First Architecture | Match content structure to buyer psychology | Front-load verdict, use decision matrices, map to use-cases | Reduces bounce, increases CVR by 40-60% |
| 2. Continuous Iteration | Maintain freshness & algorithmic favor | Quarterly updates, pricing refreshes, new competitor additions | Sustains rankings, compounds traffic over 12-18 months |
| 3. CTA Psychology | Guide users without triggering sales resistance | Contextual placement, benefit-framed language, micro-commitments | Increases CTR by 2-3x, improves trust signals |
| 4. SEO Multi-Targeting | Maximize visibility across related queries | Semantic keyword clustering, internal linking, schema markup | Drives traffic from 15-20 entry points, not just one keyword |
Let's break down how each pillar was executed in practice.
1. Intent-First Architecture
The article didn't waste time on fluff. It was structured to resolve uncertainty as quickly as possible. The opening paragraph delivered a clear, experience-based verdict. Within the first scroll, users saw a comparison matrix highlighting pricing, core features, learning curve, and ideal user profiles. This wasn't designed to impress; it was designed to decide.
Key structural elements:
- Front-Loaded Recommendation: "If you're a solo founder prioritizing speed, choose X. If you're scaling a team, choose Y."
- Use-Case Mapping: Each tool was evaluated against specific workflows (e.g., "Best for async communication," "Best for client billing").
- Transparent Limitations: "Not ideal for X, but perfect for Y" reduced cognitive dissonance and increased conversion likelihood by 20-30%.
When content aligns perfectly with intent, users don't shop around. They convert.
2. Continuous Iteration (The Living Asset Model)
Most creators treat articles as one-time publications. This creator treated theirs as a revenue asset. Every 60-90 days, the article was updated with:
- Pricing & Feature Refreshes: SaaS tools change monthly. Outdated pricing kills trust and CVR.
- New Competitor Additions: As new tools entered the market, they were integrated into the comparison matrix.
- Performance Data Updates: Real usage metrics, load times, and support response times were refreshed to maintain authority.
Search engines reward freshness. Users reward accuracy. Each update sent positive ranking signals, maintained topical relevance, and prevented competitor outranking. Optimization consistently outperforms expansion.
3. CTA Psychology & Contextual Placement
"Click here" is dead. In 2026, CTAs must be benefit-framed, psychologically timed, and contextually embedded. This article placed affiliate links exactly where intent peaked:
- Post-Feature Explanation: "If automating client invoices is your priority, start your free trial here."
- Post-Comparison Verdict: "Check current pricing and availability for [Tool]."
- Soft Micro-Commitments: Email capture for a "Setup Checklist" nurtured users who weren't ready to buy immediately.
The links didn't feel like ads. They felt like logical next steps. This reduced sales resistance and increased click-through rates significantly. For advanced conversion frameworks that turn these principles into predictable revenue, see The Ultimate Affiliate Funnel for High-Converting Traffic in 2025.
4. SEO Multi-Targeting & Semantic Clustering
The article wasn't optimized for a single keyword. It was engineered to rank for a semantic cluster of related queries:
- Primary: "Tool A vs Tool B for remote teams"
- Secondary: "Best alternative to Tool A," "Tool B pricing breakdown," "Is Tool B worth it in 2026?"
- Long-Tail: "How to migrate from Tool A to Tool B without data loss"
By covering related search intents within one comprehensive page, the creator expanded visibility without diluting focus. Internal links from supporting articles funneled authority to the pillar, while schema markup (FAQ, ComparisonTable, Review) enhanced rich snippet eligibility. This transformed a single page into a multi-entry traffic engine. For a strategic breakdown of attracting high-intent visitors, explore Traffic Domination 2026: How to Attract High-Intent Visitors.
The Compounding Math: How 1% Gains Become Recurring Revenue
Recurring income isn't generated by viral spikes. It's generated by compounding optimizations. Small, consistent improvements across CTR, CVR, and RPV create exponential revenue growth. Here's the realistic trajectory for this asset:
| Phase | Traffic | CTR | CVR | RPV | Monthly Revenue |
|---|---|---|---|---|---|
| Months 1-3 | 800 | 2.1% | 2.8% | $0.32 | $256 |
| Months 4-6 | 1,400 | 3.4% | 4.1% | $0.68 | $952 |
| Months 7-12 | 2,800 | 4.8% | 5.6% | $1.12 | $3,136 |
| Months 13-18 | 3,500 | 5.2% | 6.1% | $1.48 | $5,180 |
Notice the pattern: traffic grew steadily, but revenue grew exponentially. Why? Because CTR and CVR improvements compounded with RPV optimization. A 0.5% lift in CTR and a 1% lift in CVR might seem minor, but across thousands of visitors, it translates to thousands of dollars in additional monthly income. For advanced tactics on maximizing the value of every visitor, dive into Maximize Revenue Per Visitor: The 2026 Playbook.
The Replication Blueprint: Step-by-Step Execution
This isn't a unique talent. It's a documented system. Follow this phased approach to replicate the results:
- Phase 1: Intent Validation (Days 1-3)
- Identify 3-5 commercial comparison queries with low competition and clear purchase intent.
- Validate demand using search volume, forum discussions, and competitor gap analysis.
- Map the buyer journey: awareness → consideration → decision.
- Phase 2: Asset Construction (Days 4-10)
- Draft a comprehensive comparison matrix (pricing, features, use-cases, limitations).
- Front-load the verdict. Use real testing data, screenshots, and transparent pros/cons.
- Embed contextual CTAs after problem resolution and proof delivery.
- Phase 3: Launch & Indexing (Days 11-30)
- Publish with clean schema markup (FAQ, ComparisonTable, Review).
- Submit to Search Console. Build 2-3 internal links from supporting articles.
- Track initial impressions, CTR, and dwell time.
- Phase 4: Iteration & Compounding (Months 2+)
- Review performance monthly. Optimize meta titles for CTR, update pricing quarterly.
- Add new competitors or features as the market evolves.
- Repurpose into email breakdowns, community guides, and short-form hooks.
For a complete system on structuring scalable content pipelines, see Creator Growth Systems: How to Build a Scalable Content Engine in 2026.
Final Insight: Build Assets, Not Inventory
The creator economy rewards those who think in equity, not output. Inventory depreciates. Assets appreciate. A single comparison article, engineered with intent alignment, continuous iteration, and conversion architecture, will generate predictable income long after the publishing date. It doesn't require viral moments. It requires systematic execution.
Stop treating content as disposable posts. Start treating it as revenue nodes. Map to intent. Optimize relentlessly. Compound strategically. When you build assets instead of inventory, growth stops being a grind and starts being a flywheel.
The infrastructure exists. The frameworks are proven. The only variable left is execution.
Frequently Asked Questions
How long does it take for a comparison article to generate recurring income?
Most creators see initial traction within 4-8 weeks of indexing. Meaningful, compounding revenue typically builds over 3-6 months as search velocity increases, CTR/CVR baselines stabilize, and iterative optimizations compound. Timeline depends on niche competitiveness, content depth, and update consistency.
How often should I update a comparison article?
Quarterly updates are ideal for SaaS and tech niches. Refresh pricing, feature changes, and competitor additions every 90 days. This maintains algorithmic freshness, preserves trust signals, and prevents competitor outranking. Track ranking drops or CVR declines as triggers for immediate updates.
What niches work best for comparison content?
High-ticket, recurring-commission niches perform best: SaaS, finance tools, productivity software, health supplements, and B2B services. These categories have clear decision thresholds, transparent pricing, and strong affiliate payouts. Avoid low-margin, commoditized products where comparison adds little value.
Can beginners replicate this without SEO experience?
Absolutely. Comparison content relies on structure and intent alignment, not technical complexity. Focus on clear matrices, transparent pros/cons, and contextual CTAs. Use free tools like Google Search Console and keyword planners for validation. Consistency and iteration matter more than advanced SEO tactics.
How do I track which comparison articles perform best?
Focus on RPV (Revenue Per Visitor), not just traffic. Track CTR, CVR, and average commission per article. Use integrated analytics dashboards to centralize data, eliminate manual spreadsheets, and surface actionable insights weekly. Double down on high-RPV assets, retire or restructure underperformers.